
Ready to turn scattered marketing and product data into clear, shareable dashboards your team actually uses? This guide gives you practical Google Looker Studio tips, from the setup basics to advanced automation patterns that scale across teams.
You will learn what Looker Studio is, its key features, how to connect your data and build your first report, five beginner tips that prevent rework, and advanced techniques for automation, performance, and governance. Where it matters, we reference official documentation so you can move fast with confidence.
WHAT IS GOOGLE LOOKER STUDIO?
Google Looker Studio is Google’s free, browser based data visualization tool for building interactive dashboards and reports. It connects to Google and non Google data sources, lets you design charts with simple drag and drop, and share insights securely with your team or clients. Looker Studio Pro is the paid version that adds enterprise features such as team workspaces, enhanced asset management, and support options that help with governance at scale. See the official overview for capabilities and differences.
For executives, the value is simple. You centralize KPIs from sources like Google Analytics 4, Google Ads, BigQuery, Salesforce, and CSVs, then share a live dashboard that updates on a schedule. No more manual spreadsheet screenshots.
Bottom line: Looker Studio is ideal for lightweight BI, marketing performance, and executive views. For heavy semantic modeling or strict data governance, use a warehouse such as BigQuery with data modeling upstream, then visualize in Looker Studio.
KEY FEATURES OF GOOGLE LOOKER STUDIO
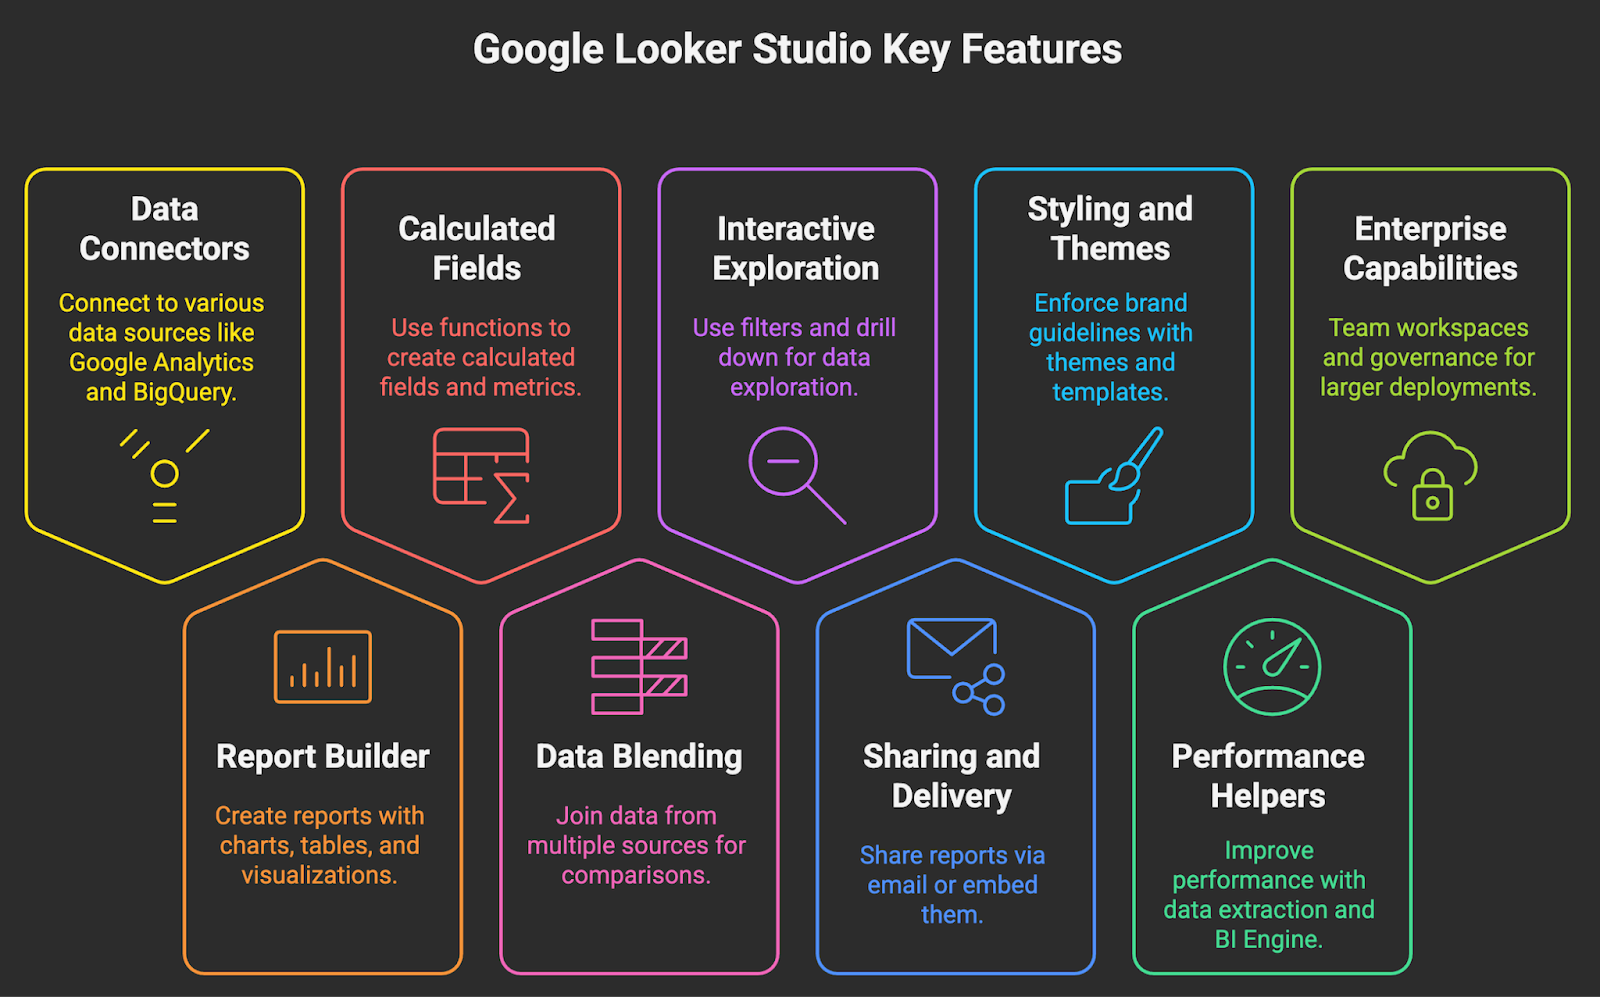
- Wide range of connectors, including Google Analytics 4, Google Ads, Search Console, BigQuery, Sheets, and partner connectors like Supermetrics and Fivetran.
- Drag and drop report builder with charts, tables, scorecards, time series, maps, and community visualizations.
- Calculated fields and reusable metrics using functions like CASE, REGEXP, and date math.
- Data blending to join up to five sources on a common key for quick comparisons, such as ad spend vs conversions.
- Filters, date controls, parameters, and drill down for interactive exploration.
- Scheduled email delivery and one click sharing to viewers or editors, plus embed options.
- Themes, layout templates, and styling to enforce brand guidelines.
- Performance helpers such as Extract Data to cache results and BigQuery BI Engine for sub second queries at scale.
- Enterprise capabilities with Looker Studio Pro, including team workspaces and governance that reduce risk in larger deployments.
GETTING STARTED WITH GOOGLE LOOKER STUDIO
- Create or sign in to your Google account. Go to Looker Studio and select Personal or, if you have licenses, a Pro team workspace.
- Choose your first data source.
- Start simple with Google Analytics 4, Google Ads, Search Console, or Google Sheets.
- For scale, connect to BigQuery. It is more reliable for larger data sets than direct API connectors which may hit quotas. GA4 Data API quotas. GA4 BigQuery export.
- Authorize the connector and configure fields.
- Grant OAuth access when prompted. Confirm the account, property, or dataset.
- Review the schema. Set correct data types and default aggregation to avoid wrong totals later.
- Create your first report.
- Use a template to accelerate setup or start blank and add charts.
- Add date controls, filters, and a few core KPIs. Keep it lean for performance.
- Blend data only when needed.
- Use blending for quick, lightweight joins, for example joining campaign cost to CRM pipeline stages.
- For complex joins or large tables, pre model in BigQuery using views or materialized views, then connect.
- Share and set schedules.
- Invite viewers or editors. Set scheduled email delivery for weekly leadership updates.
- Document ownership and access in a shared workspace if you use Pro.
Choosing the right connector is a strategic decision. Use this quick guide.
HOW TO USE GOOGLE LOOKER STUDIO?
The interface is straightforward. The canvas is the central area where you place charts. The Data pane shows your connected sources, fields, and calculated fields. The right side Properties panel lets you switch between Data and Style settings for any selected chart. The top bar provides report level controls for adding charts, controls, themes, and sharing.
Core actions you will perform frequently:
- Create a report from a template or blank canvas, then connect a data source.
- Add charts such as tables, scorecards, time series, bar charts, and maps. Assign dimensions and metrics, choose aggregations, and apply filters.
- Add controls, for example a date range selector, a dropdown filter for channels, or a parameter for scenario planning.
- Create calculated fields for reusable KPIs. For example, a CASE statement that standardizes campaign names across platforms.
- Blend data for a quick left join across up to five sources, such as cost data joined to revenue.
- Share your report with viewers, schedule email delivery, or embed securely in an internal wiki or portal.
5 ESSENTIAL TIPS FOR BEGINNERS
- Anchor reporting on a handful of KPIs before you design.
Decide the five metrics that matter to the business outcome, for example CAC, conversion rate, LTV, active users, and churn. Design the canvas around those. Avoid adding every metric you can connect to, which slows the report and buries the signal. - Use BigQuery for scale, the GA4 connector for speed to value.
If you are prototyping or the team is small, start with the native GA4 connector. When you hit API quotas or want cohort level detail, link GA4 to BigQuery and build your report on the export tables. - Create calculated fields once at the data source and reuse them.
Define standard channel groupings, gross margin, or pipeline stage logic at the source, not per chart. This enforces consistency and makes edits propagate. - Keep pages lean and cache heavy queries.
Limit charts per page, avoid unnecessary table pagination, and use the Extract Data connector to cache static or slow queries. For warehouse sources, accelerate with BigQuery BI Engine. - Standardize look and feel to build trust.
Set a theme, grid, and typography. Align decimals, currencies, and number formats. Use color intentionally for status and variance, not decoration. Clear design reduces interpretation time for leadership.
ADVANCED TIPS AND TRICKS
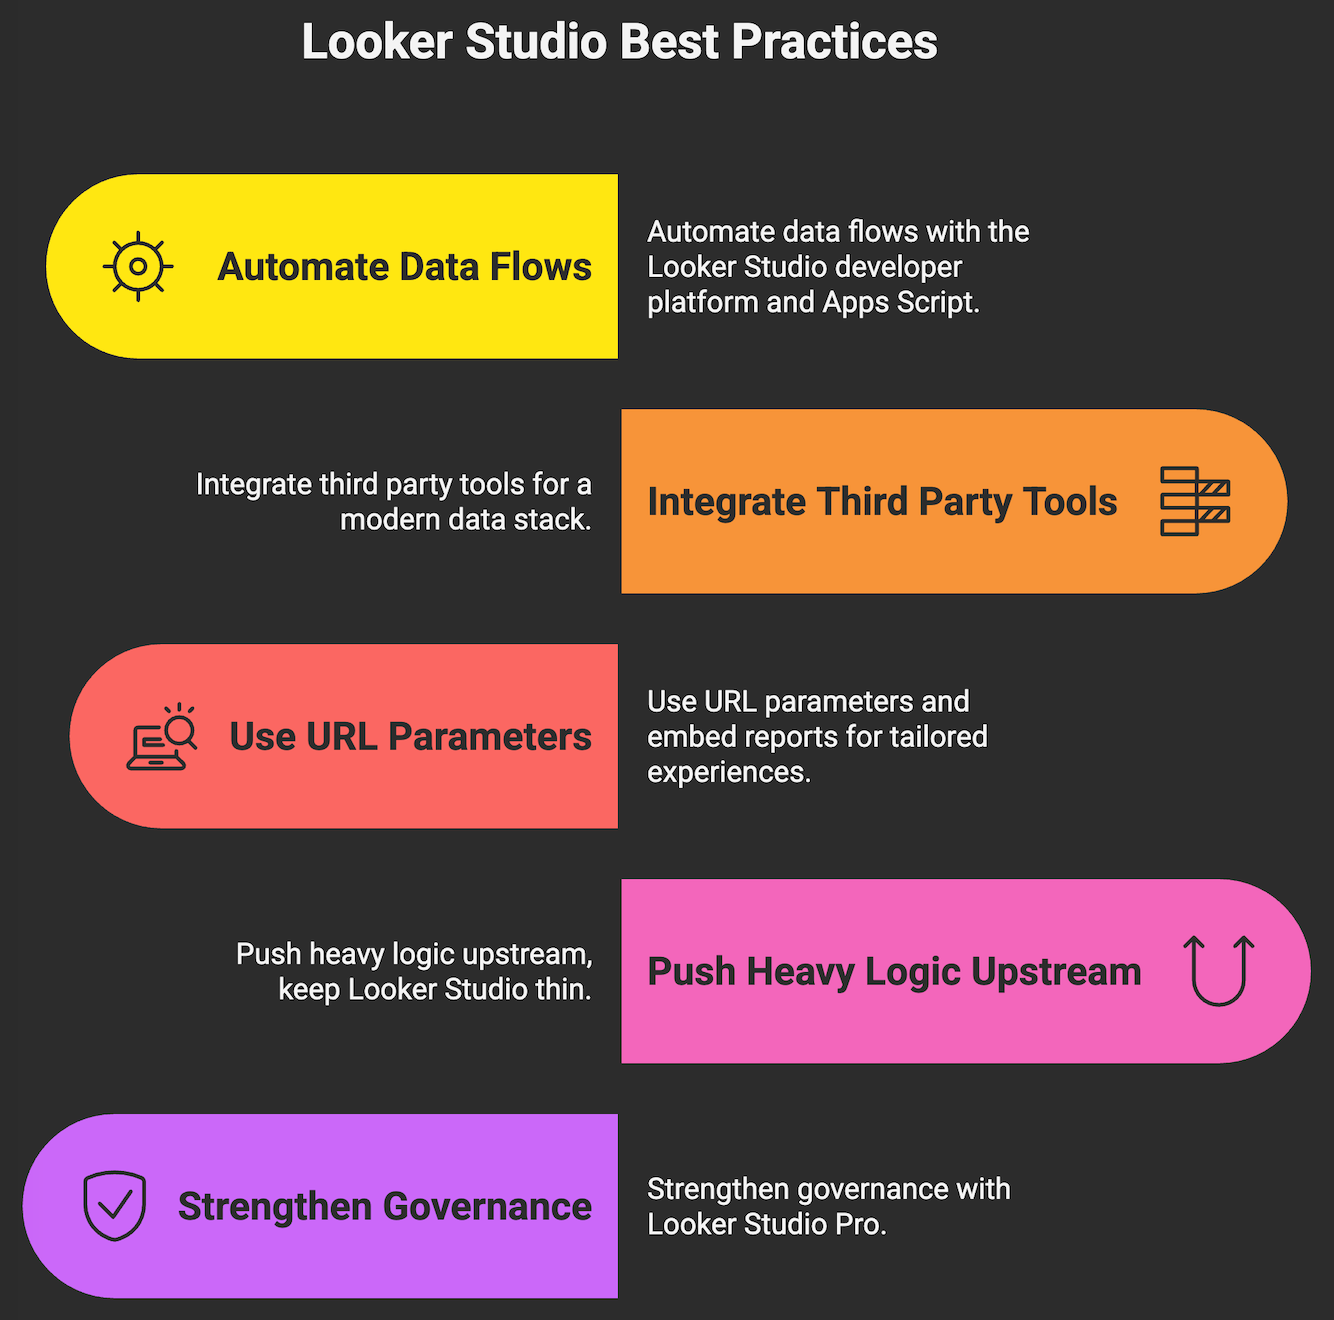
- Automate data flows with the Looker Studio developer platform and Apps Script.
When a native connector does not exist, build a custom data connector using Apps Script or Cloud Functions. Automate refresh and schema mapping so reports update without human intervention. - Integrate third party tools for a modern data stack.
Extract from ad platforms with Fivetran, Supermetrics, or Airbyte into BigQuery, transform with dbt, then visualize in Looker Studio. This pattern centralizes governance and reduces connector limits while keeping dashboards fast. Fivetran to BigQuery. Supermetrics docs. Airbyte docs. - Use URL parameters and embed reports for tailored experiences.
Create URL parameterized deep links that pre filter reports for a region, client, or product line. Embed those filtered views in your internal wiki or customer portal. This reduces report proliferation and improves adoption. - Push heavy logic upstream, keep Looker Studio thin.
Model complex joins and business rules in BigQuery using views or materialized views. Expose clean, documented tables to Looker Studio. You get faster dashboards, clearer lineage, and fewer breaking changes. See BigQuery views and Materialized views. - Strengthen governance with Looker Studio Pro.
Use team workspaces to centralize ownership, apply naming conventions, and minimize sprawl. Pro support and admin features help your BI program scale safely.
Are you ready for acceleration? Makeitfuture designs and automates analytics stacks that pay for themselves. From BigQuery modeling and .dbt orchestration to Looker Studio dashboards and embedded analytics, we build the pipeline, enforce governance, and hand you a playbook.
NEXT STEPS IN MASTERING GOOGLE LOOKER STUDIO
If you need one action this week, pick a business outcome and build a single page dashboard around it. Connect the smallest viable data source, define five KPIs, add minimal controls, and schedule a weekly email to stakeholders. Ship, then iterate.
To continue mastering Looker Studio:
- Adopt a warehouse first approach for anything beyond simple marketing dashboards. Land data in BigQuery, model with dbt, then connect. BigQuery.
- Level up with official training and docs. Complete Google’s courses for Looker Studio and don’t forget to bookmark the Help Center.
- Standardize governance. Define naming, foldering, and sharing practices. Use Pro team workspaces when you are ready to scale.
- Measure adoption. Track report views, stakeholder feedback, and time saved on manual reporting to confirm ROI. Optimize or retire unused pages.
- Contact us for helping you with automation and embedding use cases. We can help your team accelerate without adding headcount.
Use these Google Looker Studio tips to move from one off dashboards to a reliable decision system. Keep the surface area small, push complexity into the data layer, and automate the rest.


.png)
.png)
.png)